Een Nederlandse versie kan je hier vinden
The idea of a universal basic income (UBI) is gaining traction on the whole political sphere. The central concept is that every citizen gets a monthly allowance that is above the poverty line with no mandatory requirements (e.g., having to apply for a job). Even if you do have a salary, you would still get the monthly UBI on top of it. As the concept is assuming a grand an universal scale the main objection and point of discussion is how to be able to be able to fund the program.
The left is seeing a UBI as an opportunity to make society more equal by putting a higher tax burden on companies and the rich. The right, naturally, does not agree and is mainly focusing on funding a UBI by removing welfare programs and removing benefits for people that need it. These discussions hijack the focus away from the fundamental concepts of UBI. Furthermore, they do not help in creating a realistic plan to fund the operation which makes the chance of it being implemented anytime soon small.
The truth is that we do not need to change too much of the outcome of the current income distribution to implement a UBI. We can think of solutions that do implement a UBI but which do not change too much of the overall spending power of citizens. Paradoxically, we need to be willing to alter big government levers to keep the effects of implementing a UBI to a minimal. Resulting in that a household with a median earning income will not suddenly have an extra €17,000 to spend yearly. The most important and easiest lever to adjust is the income tax.
Distribution of income
Before we can adjust the income tax, we must understand the details of the income distribution. Let’s look at some data from my country: the Netherlands, a fairly social-liberal country. The latest published data on income distribution is from a trustworthy government agency that consists of statisticians (CBS) and is from 2014. Figure 1. shows the disposable income distribution in a visualization, which is the income after income tax.
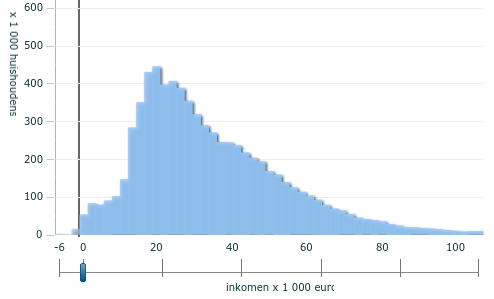
Figure 1. Disposable income distribution in the Netherlands 2014 CBS
The total disposable income is €264 billion (miljard) for 7,6 million households in 2014. The average household consist of 2,2 persons. Table 1. shows the income distribution per household in groups separated into five groups with the same number of households ordered by low to high disposable income.
| Group | Percentage of income | Average income household | Total income in billion |
|---|---|---|---|
| Lowest income | 6,6% | €11.550 | 17 |
| Low (20-40%) | 12% | €21.000 | 31 |
| Median (40-60%) | 16,6% | €29.050 | 44 |
| High(60-80%) | 23,3% | €40.775 | 62 |
| Highest income | 41,5% | €72.625 | 110 |
The lowest income groups
The lowest income group primarily consist of single-adult households (Figure 2), this group includes single-parent households. Furthermore, most of the households are below the age of 65 (Figure 3). The age of the lowest end of the distribution is mostly below 25 (Figure 4).
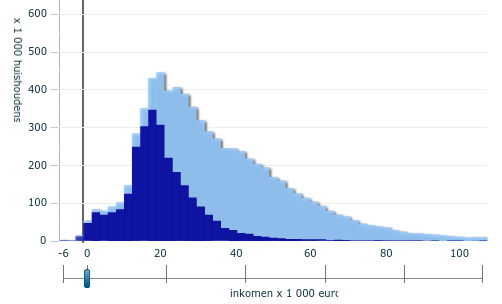
Figure 2. Single-adult households
[/caption]
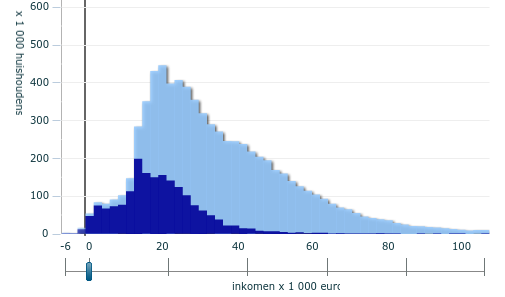
Figure 3. Single-adult households below the age of 65
[/caption]
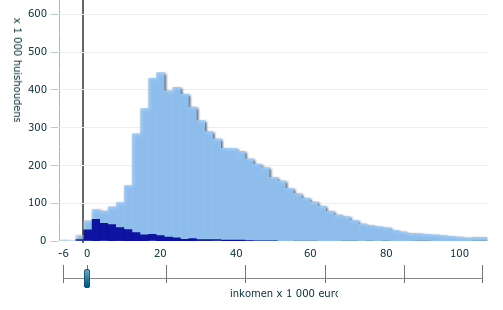
Figure 4. Households where the main breadwinner is under the age of 25
The minimum wage in the Netherlands is €17.284 a year after taxes. You will have around the same disposable income when you are in a multi-adult household on common welfare. There are 756.000 households that are on welfare in the income distribution. Figure 5. shows the distribution of households that are primarily living on welfare.
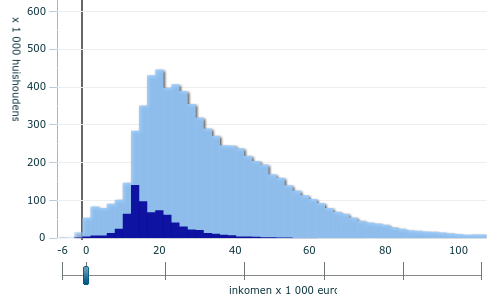
Figure 5. Households primarly living off welfare
Other government benefits
We already have a basic income system in the Netherlands for people that are over the age of 67. With the caveat that you are likely going to get fired from your current job when you reach that age, and that the height of the allowance depends on how many years you lived in the Netherlands. There are 3.3 million people receiving the old age allowance, where 1.9 million households have pensions as their main source of income. The allowance is a slightly lower than normal welfare. The income for these households is raised by mandatory participation in retirement funds when a person was employed. Figure 6. shows the distribution of households that have pensions as their primary income.
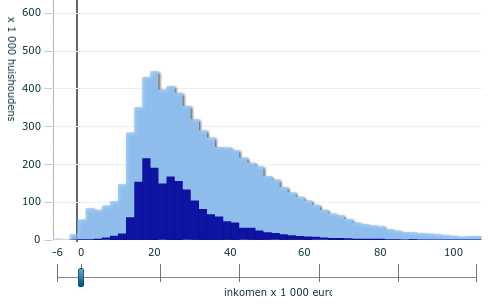
Figure 6. Households primarly living off retirement funds.
In total, around 5 million people receive some sort of allowance from the government. This data excludes government programs that give financial support for renting a house (huurtoeslag) and healthcare insurance (zorgtoeslag) which mostly apply to households with incomes lower than €35.000.
Households with primary income from work
In figure 7, we see that the primary income for 3.7 million households is employment. Figure 8, shows that 829.000 households get their income mostly from profit (e.g., from a company). We see that mostly the higher income households have two income earners.
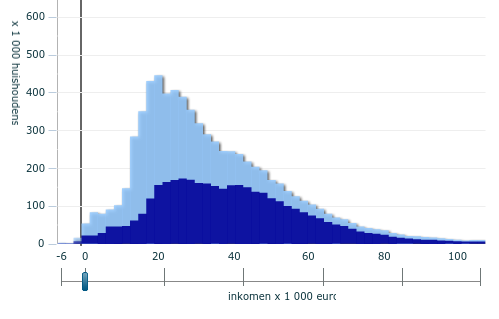
Figure 7. Households primaraly living of wages
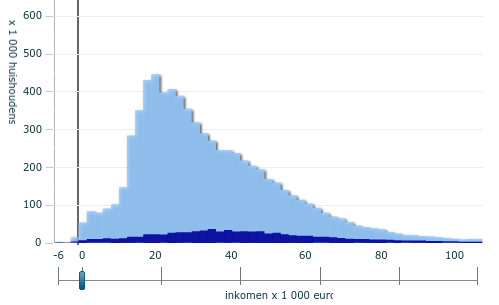
Figure 8. income mainly from profit
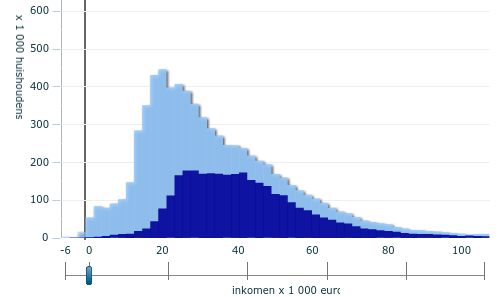
Figure 9. Two person income households
Households property ownership
Mostly the lower income groups are renting and do not own a house which is shown in figure 10. Figure 11. shows the households which own their house.
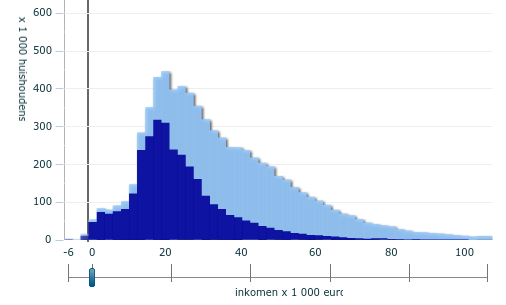
Figure 10. Households that rent
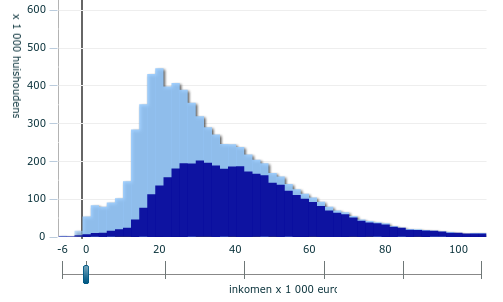
Figure 11. Households that own a house
Summary
In table 2, we split the percentages of households based on where they get their primary income. The households that get their primary income from work and profit are the primary suppliers of the income tax the government receives.
| Income primary from | Households |
|---|---|
| Work | 52% |
| Profit | 12% |
| Pension | 26% |
| Welfare | 11% |
Distribution and height of a Universal Basic Income
For this experiment, we set the height of the UBI the same as the minimum wage of €17.284 a year, tax-free, for a multi-adult household. Often calculations for a UBI are done for individual persons. However, this is not fair as life is more costly when you are living alone. You would struggle for €1000 a month when you are living alone. However, €2000 of disposable income for a two-person household is way above the poverty line. Realistically, the height of the UBI should take into account the size of the household, similar as we do for welfare. Therefore, for single-adult households, we set the height of the UBI to €11.905.
| Single-adult household | €11.905 |
| Multi-adult household | €17.284 |
We have to decide if we would want to give a UBI to the households where the primary breadwinner is 25 or younger. There are 339.000 households in this group for which a UBI could mean a vast improvement of their income. As there are 865.950 students between the age of 18 and 25, it is safe to assume the fast majority of these households consist of students. As this experiment is to leave as much of the income distribution in place, and the fact that students in the Netherlands certainly do not need financial help, I decide to set the minimum age for a UBI to 25.
Furthermore, the pension system is complex and is quite similar to a UBI. Therefore, we do not include them in the new UBI program, and we set the maximum age to 67.
Cost of the Universal Basic Income
So how many households will get a basic income in this scheme? 5.067.000. Table 4. shows the number distribution per household type and costs for the UBI.
| Type of household | Number of households | Cost of the UBI |
|---|---|---|
| Single-adult | 1.599.000 | €19.033.963.000 |
| Multi-adult | 3.475.000 | €60.064.996.000 | Total | 5.067.000 | €79.098.958.000 |
Caveat
This 79 billion is just the cost of providing the income and does not account for the potential, loss of taxes when people reduce their working hours. There is little we know about how much people will stop working when a UBI is in place. There is some indication that on average household will work around 20% fewer hours but this probably can be influenced on how much work is incentivized financially. Furthermore, the financial effects can be balanced by people that enter the workforce on part-time jobs which currently are on welfare. Also, there is a potential of seeing an increase in economic activity when lower-income households get more to spend. Therefore, we will not account for this potential loss in taxes in the calculations.
Current income tax
The current income tax rate in the Netherlands for 2018 is displayed below in table 5.
| Tax bracket | Income | Percentage tax |
|---|---|---|
| First bracket | Till €20.142 | 36,55% |
| Second bracket | Till €33.994 | 40,85% |
| Third bracket | Till €68.507 | 40,85% |
| Fourth bracket | From €68.507 | 51,95% |
With tax credits the tax pressure is a bit lower than suggested in the table. Especially, for people that are self-employed.
In the calculations later in the article we use the calculated income taxes from this online tool. These values can be shown in the column named “Tax before UBI” in this spreadsheet. We assume that the income tax is similar for households with multiple income earners versus single-income earners (In reality this could differ slightly). Table 6. shows how the current income tax would play out for some incomes.
| Income | Tax | Disposable income |
|---|---|---|
| €6.000 | €0 | €6,000 |
| €20.000 | €1.919 | €18.081 |
| €30.000 | €6.321 | €23.679 |
| €40.000 | €11.116 | €28.884 |
| €75,000 | €28,722 | €46,278 |
A new income tax of 72%
So what would happen when we add a UBI and change the income tax brackets to two brackets and include a stunning 72% income tax rate! This new tax bracket system, shown in table 7, should only apply on people on the UBI.
| Tax bracket | Income | Percentage tax |
|---|---|---|
| First bracket | Till €45.000 | 72% |
| Second bracket | After €45.000 | 51,95% |
Let’s explore the question with a few different personas (the names are fictional and not based on real people):
Tragic Jan
Jan is 54 years old and lives alone and due circumstances he is on welfare for 10 years and he has no ambition to ever work again. He submits to the mandatory requirements of welfare by sending regular application letters that will never get him a job.
With a UBI, Jan will receive the same income, and he can stop sending application letters. There is a small chance that society can pursue him to enter the workforce for at least a couple of hours to slightly increase his income.
Bob the construction worker
Bob has a family where his wife does not have a job but takes care of the two kids. Bob does not have a high IQ, but he managed to learn a craft and land a full-time job on minimum wage (around €17.284, after taxes). They are struggling financially to make ends meet, but they manage.
On a UBI, Bob decided to not reduce his working hours as he likes his work. Now with an income tax of 72%, he will pay a total income tax of €13.633. In total, his household income after taxes will be €22.587, significantly higher (€5.303) than it was before.
Oliver and Jasmine
This young couple is highly educated and they have no kids. They like to travel a lot, live in a nice house, and they are both working 32 hours a week. Oliver is making a bit more than Jasmine. They earn €40.000 which results to €29.000 of disposable income. They never experienced financial problems in their lives.
As they like their lifestyles, when their household receives a UBI they do not reduce their working hours. Now, the €40.000 is taxed for €28.800 making their total disposable income €28,484, which is similar as before.
David the director
David is 52 and has a senior management position in a decent-size firm, and his salary is €90.000. He has a family, and his wife makes some income from her own business for fun and makes €25.000. Their total income after taxes is €67.940.
In this UBI program, the first €45.000 is taxed for €32.400; the latter €70.000 is taxed for 51.95% at €36.365. The total income of their household after taxes is €63.519. A bit lower but quite similar as before the UBI was implemented.
Unlucky Jim
Jim is a single bachelor with a job where he makes €40.000 which is €28.884 after taxes.
When such a UBI schema is implemented, he is an unintended loser because he gets the UBI of the single-adult household, but he is taxed the same as a multi-adult household. Therefore, he will have a tax free income of €23,105. Much lower of that of Oliver and Jasmine.
Therefore, we add a compensation in the form of a tax credit up to €10.000 for single-adult household that make €17,000 or more. This tax credit is just an example of how a balancing act should work when implementing a UBI to make sure there are no unintended outliers either on the positive or negative side. In reality, this should be done in a political process, and it can take many other forms.
However, even with the tax credit, Jim decided to work less working hours which he spends on his study. His salary from work is reduced to €20.000. His income with a UBI is €22.884.
So back to the statistics, which households will benefit?.
As we see the only households that financially benefited was the household of Bob. In reality, any household with an income lower than €36.000 (before taxes) gets an increase of their income. It seems politically viable to slightly raise the income of the lower income households that work and to slightly decrease the income of the higher income groups.
So how much does it cost? Time for some calculations
To answer this question, we go back to the income groups. We have to make a few assumptions about the distribution. First, we need to get the percentages for how many households get their income from work. We calculate this with this formula:
Percentage for work per income group = (Households primary from work + Households primary from profit) / Total households minus pensions.
We assume the percentages are the same for the subset of the total distribution that gets a UBI.
Furthermore, we need to know how many households are single-adult versus multi-adult per income group. We counted all single-adult households in the main distribution and derive the percentages from that. It is likely that the percentages for single-adult households are a bit higher than in reality because it is likely that the households we excluded where primary breadwinner younger than 25 would contain more single-adult households than average.
We combine the costs for households that receive a UBI with the distribution of the disposable income groups. To do this, we take the median of the disposable income and calculate how much income the household would have earned in a UBI system. Then we calculate how much a single-adult and multi-adult household would cost by comparing it with the current income tax. The full calculation is in this spreadsheet. Table 8. shows a subset of the cost per income group and how much it is split between working vs. non-working households and single versus multi-adult households. The result is that the UBI will cost less than 10 billion after the new income tax.
| Income group | Cost single-adult with work (in millions) | Cost multi-adult with work (in millions) | Cost single-adult with no work (in millions) | Cost multi-adult with no work (in millions) | Cost total (in millions) |
|---|---|---|---|---|---|
| €0-€2.000 | €124M | €27 | €105M | €22M | €280M |
| €2.000-€4.000 | €86M | €14M | €164M | €25M | €289M |
| €4.000-€6.000 | €116M | €30M | €162M | €37M | €346M |
| €6.000-€8.000 | €169M | €59M | €135M | €38M | €404M | €8.000-€10.000 | €168M | €69M | €208M | €64M | €512M | €10.000-€12.000 | €170M | €67M | €563M | €144M | €946M |
| €12.000-€14.000 | €187M | €74M | €1.415M | €288M | €1.965M |
| €14.000-€16.000 | €120M | €85M | €969M | €222M | €1.398M |
| €16.000-€18.000 | €402M | €143M | €638M | €224M | €1.408M |
| €18.000-€20.000 | €295M | €229M | €598M | €393M | €1.517M |
| €20.000-€22.000 | €152M | €267M | €402M | €473M | €1.296M |
| €22.000-€24.000 | €109M | €246M | €223M | €400M | €979M |
| €24.000-€26.000 | €22M | €166M | €140M | €336M | €667M |
| €26.000-€28.000 | -€38M | €57M | €89M | €271M | €380M |
| €28.000-€30.000 | -€80M | -€188M | €75M | €276M | €83M |
| €30.000-€32.000 | -€75M | -€217M | €41M | €191M | -€59M |
| €32.000-€34.000 | -€66M | -€238M | €26M | €160M | -€118M |
| €34.000-€36.000 | -€45M | -€256M | €12M | €115M | -€172M |
| €36.000-€38.000 | -€44M | -€298M | €9M | €103M | -€229M |
| €38.000-€40.000 | -€34M | -€323M | €6M | €91M | -€259M |
| €40.000-€42.000 | -€34M | -€329M | €4M | €75M | -€283M |
| €42.000-€44.000 | -€24M | -€331M | €2M | €62M | -€290M |
So how would we pay for what is left?
A large part of the costs of the UBI consist of people that are currently on welfare. We assume that 90% of households that currently are on welfare are in the subset of our UBI selection. Furthermore, we assume that the current UBI is 80% of the current welfare height (e.g., disabled people get a higher income than people on common welfare, and this is difficult to generalize). This result in that we can subtract the cost for welfare for these households to receive the same height of income. We use this data as an estimate of the current costs of welfare.
| Welfare | Total Cost | Cost subset UBI | Cost savings in UBI |
|---|---|---|---|
| WWB | €6.115 million | €5503 million | €4.402 million |
| WIA | €4.512 million | €4060 million | €3.248 million |
| Wajong | €3.163 million | €2846 million | €2.276 million |
| WAO | €4.299 million | €3869 million | €3.095 million |
| WAZO | €1.135 million | €1021 million | €816 million |
| Total | €19.224 million | €17.301 million | €13.841 million |
So we have the costs for a UBI covered by just these savings alone in combination with the new income tax brackets. We even have somewhat of a buffer of 4 billion to account for households that could stop working.
New income distribution
With the calculations of the costs of a UBI in place, we can derive how this would change the income groups for the subset of the distribution that receives a UBI. Table 10. shows that the result is more equal than the income groups we had before in table 1. but still with enough variety and similarity to make it politically viable.
| Group | Number of households | Percentage of income | Average income household | Total income in billion |
|---|---|---|---|---|
| Lowest income | 873.000 | 7% | €15,227 | 13 |
| Low | 1.163.000 | 15% | €23,037 | 26 |
| Median | 974.000 | 17% | €31,726 | 30 |
| High | 976.000 | 23% | €42,910 | 41 |
| Highest income | 1.088.000 | 39% | €64,294 | 69 |
| Total | 5.074.000 | 100% | €36,031 | 182 |
Conclusion
This article shows that it is possible to finance a UBI without drastic changes in the income distribution. I hope these sort of experiments can contribute to direct the discussions to the details of the implementation phases instead of the ideology realm. Furthermore, it could be useful to counter the arguments of people that think a Universal Basic Income is impossible to implement because the costs are too great. When we set it to households between the age of 25 and 67 with a new income tax bracket system, we would be able to pay for it without too many issues in the Netherlands. So the idea deserves some consideration before dismissing it because it is possible to implement. Mainly, because it could improve the lives of a significant portion of the population that is now trapped in welfare.
Thank you
Thanks for reading this article and please let me know in the comments what your thoughts are. If you like the article please consider sharing it with your peers or friends. If you really liked it please consider supporting this independent blog financially, either by becoming a patron or donating directly.


7 Comments
nielsvandermolen · July 28, 2018 at 5:07 am
Other locations for comments:
https://www.reddit.com/r/BasicIncome/comments/92favk/a_realistic_plan_to_pay_for_a_universal_basic/
https://www.facebook.com/nielsvandermolen
https://twitter.com/NielsMolen
Joop Böhm · July 28, 2018 at 2:06 pm
“It Don’t Mean a Thing If It Ain’t Got That Swing” aldus de lyrics die Irving Mills in 1931 schreef voor Duke Ellington’s muziekstuk. Het deugt niet als het niet swingt. Dat geldt ook voor het UBI dat Niels van der Molen ten tonele voert in zijn stuk “A realistic plan to pay for a UBI in the Netherlands”. Het voldoet niet aan de eisen waaraan een UBI moet voldoen en dus is het ondeugdelijk.
Een tweede opmerking die ik zou willen maken: Als het artikel gaat over het UBI in het algemeen, dan is er natuurlijk niets op tegen om daarvoor de Engelse taal te gebruiken. Maar gaat het specifiek over een UBI in Nederland, dan lijkt het me logisch als dat artikel in het Nederlands wordt geschreven.
nielsvandermolen · July 28, 2018 at 4:09 pm
Hoi Joop, Bedankt voor de comment ik ben niet bekend met het nummer maar zal het opzoeken. Kan je vertellen aan welke eisen van een UBI dit plan niet voldoet?
Engels is een bewuste keuze voor het blog dus ook dit artikel. Het zou namelijk ook relevant kunnen zijn voor andere landen en de meeste Nederlanders kunnen goed Engels
Esmir · August 2, 2018 at 11:30 am
I’ve had many doubts when reading this article, but I won’t dismiss it completely because of the conclusion, where the author argues that this is just one way to do it and it would be a politically viable option. If we could implement this and build (read expand) from there, I might be in.
The critique is off course that an UBI in this form is not really an UBI, it is not universal. A UBI must by definition include everyone even the elderly and students, and in some way even children. Including the elderly shouldn’t be a problem since they receive a form of UBI, so why not simply include them?
The author argues that student really don’t need financial help in the Netherlands. I would beg to disaggree. First, the government pays for 7000 euro tuition fee per student per year of the 9000euro, the rest is paid by the student, if the UBI would give the student too much money, the surplus could be balanced out with the tuition fees. However, student have much more expenses, think of books & supplies, rent etc. Few can study and live with their parents. This is why the vast majority is on student loans, which they have to pay back with future income. Future income that will partially be taxed at 72% eventhough they are repaying loans from a time when they did not receive UBI, and will they be also taxed at 72% as students on the already minimum youth wage they earn in retail or their weekend job in a cafe or restaurant? (Litteraly a 19 year old earns 5-6€ an hour before tax, that is 1,4-1,68€ after tax). Student should simply be included in the UBI.
Another problem I had when reading the article is the lack of attention to costs, agencies and control mechanisms. If UBI would be implemented, there would no longer be a need for many goverment agencies which asses and control the applies, this could be a major saving. Agencies like UWV has buildings in every city a prime locations, fully equiped offices full of public servants handeling all te applies and checking wether users are doing the right thing. This could be completely liquidated under UBI, and many more like UWV. Howerver, though government records show someones age and if they are enrolled in an university, the government cannot check wether everyone is really single or a couple. If a couple receives 17.000€ and a single 11.000€, like in some cases now with welfare, some people will register as singles to get that extra 4000€, even if it means renting a other studio or room elsewhere. So this means more bureaucracy again.
Anyway, just some thoughts.
nielsvandermolen · August 2, 2018 at 1:04 pm
Hi Esmir, thanks for your thoughtful comment.
To exclude the elderly is mainly for pragmatic reasons and to give the elderly a sense of security. We have to acknowledge that any UBI program is very ambitious and we should account for a scenario where we need to roll back the plan. Not including the elderly makes this much easier.
My main argument not to include students in the UBI is because it would change too much in the income distribution while it is not absolutely necessary. If we want to make live easier for students we could have a separate discussion about it as it does not have to tie into this plan. When they are under 25 the normal tax rates apply. When they are over 25 years old they do get taxed the 72% when they work but they also get the UBI which they can use to pay the interest. They would have very similar disposable income.
I don’t agree that the UWV organization should be dismantled necessary on the UBI. There are still people that need help finding work and there are many other types of welfare besides common welfare (bijstand).
The subject of fraud is important. In my view, it would not pay much to fraud this UBI system. In order to receive more from the UBI you must have another household and like you said rent a house or apartment. The extra $4000 the cheater thinks to gain will get evaporated quickly on rent.
Bert Timmerman · August 5, 2018 at 6:10 pm
Hoi Niels, natuurlijk wordt dit allemaal heel goed doorgerekend door de criticasters 😉 Maar waar zijn de “additional benefits” zoals verminderde uitgaven van de Overheid door een vereenvoudigd belastingstelsel ? Of wordt dat juist complexer ? En wat te doen met inkomsten uit een bedrijf ? Of inkomsten uit handelen op de beurs ? Oh, en verlies op de beurs 😉 Overigens wel een uitgebreide analyse, zo zie je ze niet vaak. Groet, Bert.
nielsvandermolen · August 5, 2018 at 7:37 pm
Hoi Bert,
Bedankt voor het bericht. Naar mijn inzien zijn de additional benefits vooral zichtbaar op lange termijn die mogelijk gemaakt worden door een UBI. Als mensen significant minder gestrest zijn kan dat gigantische voordelen opleveren voor de gezondheidkosten. Een ander voobeeld zijn een betere ondehandelingpositie voor de werknemer (hogere lonen) en soepelerer regels voor bedrijven (ontslag). Er zal echter pas behoefte zijn voor aangepaste regelgeving nadat een UBI is ingevoerd.
Verder denk ik dat we niet veel winst kunnen boeken met het reorganiseren van bijvoord het UWV omdat de kosten hiervoor “maar” 1.7 miljard zijn. En tevens de politieke boodschap niet de focus moet leggen op het kunnen stoppen met werken maar dat we vooral iedereen een betere kans kunnen geven op de arbeidsmarkt.
https://jaarverslag.uwv.nl/uwv-in-cijfers/
De complexiteit van het belastingstelsel zal wel hetzelfde blijven. Waarschijnlijk zijn er wel kosten gemoeid met het invoeren van een ander stelsel maar dat zal wel mee moeten vallen. De inkomsten voor bedrijven kunnen gewoon hetzelfde worden ingevuld, berekend en belast moeten worden, meestal met de jaarlijkse belastingaangifte. Maar misschien is er een beter systeem denkbaar.
Groet, Niels